Built for those who stay ahead in agri markets
Act with clarity, not reaction. Daily yield forecasts, ENSO scenarios and weekly crop conditions across 25 US states, with every assumption stated.
- USDA NASS
- USDA WASDE
- NOAA CPC
- US Drought Monitor
- Satellite NDVI
- CFTC
Certainty grows with the crop
At planting the whole summer’s weather is still unknown, so the range is wide. Every week of weather, satellite and crop-condition data narrows it, fastest through pollination and grain fill. We publish that range, not just a single number, so you can size positions to what is actually known.
Everything that moves corn and soy, in one place
Models, crop data, weather and positioning on one screen, built for analysts and traders who need the full picture before the market prices it in.
- 01
Daily yield forecasts
National and state yield model, updated daily, with El Niño, La Niña and neutral scenarios, drivers and analogue years.
- 02
NDVI & weekly yields
Satellite vegetation index turned into weekly yield estimates.
- 03
Crop conditions
USDA ratings by state, good-to-excellent tracking and a condition forecast.
- 04
Crop progress
Planting to harvest, stage by stage, mapped every week.
- 05
WASDE revisions
How USDA yield estimates shift through the season, with revision statistics.
- 06
Weather
Drought maps and outlook, 6–10 and 8–14 day temperature and rain forecasts, weather outliers.
- 07
ENSO probabilities
El Niño, La Niña and neutral odds that feed the forecast scenarios.
- 08
Market positioning
CFTC Commitments of Traders net positions alongside the fundamentals.
- 09
Reports & export sales
USDA report calendar and flash export sales pace.
- Next
New demand signals
What’s next: demand-side indicators, in development.
Yield model updates through the season
US states covered: 18 corn, 22 soybean
Past weather years behind the El Niño, La Niña and neutral scenarios
Data modules in one dashboard
See it in the product
Real screens from the AgriTecta dashboard: soybeans, 2026 season. Pick a view to see what you get each morning.
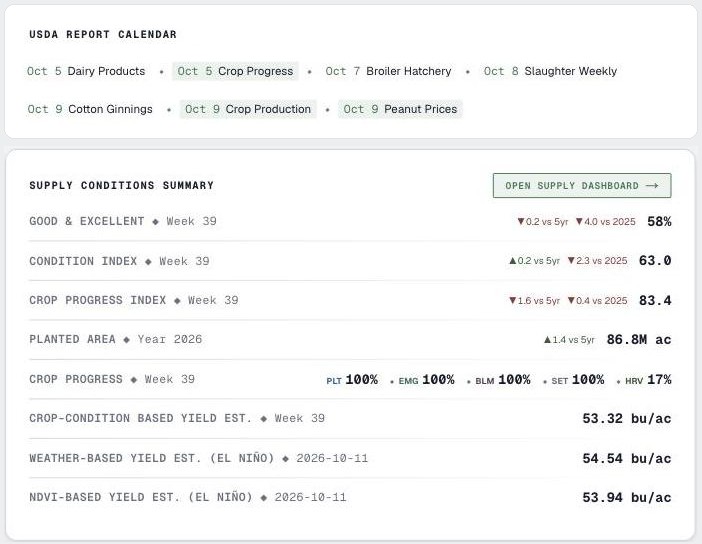
- USDA report calendar for the month ahead
- Conditions, progress and planted area vs 5-year average
- Crop-condition, weather and NDVI yield estimates side by side
Markets run on narratives. We test them.
Some narratives are grounded in data. Most are not. Our work is telling them apart, then putting numbers on what is left.
- 01
Synthesise the narrative
Every price move has a story behind it. We collect the prevailing ones and define the hypotheses they imply.
- 02
Test the hypotheses
Each claim is run against crop, weather and satellite data, separating sentiment from signal.
- 03
Quantify uncertainty
Scenarios with probabilities and explicit assumptions, so you know exactly what you are positioned on.
We don’t trade. We don’t front-run. We are research-only.
No trading book, no positions to protect, no incentive to move markets. As close as an in-house analyst, as independent as an outside partner.